

Infrastructure Deficits

I wrote a tweet here, where I go into a formula which shows that, universally, mass immigration will lead to lower qualities of life in the West:
https://twitter.com/liquidswan/status/1648396509589934080?s=46&t=7vCHwim3PRx_2oVTtCyLoA
The counter-argument of course is simply that infrastructure WILL keep up with immigration, and so our fears are silly and unwarranted. The truth is this is simply not the case, and we in the west are in a massive infrastructure deficit.
You can observe the prices of homes relative to wages for example. You can observe the relation between income and rental rates. You can see it in the price of food, and overall inflation rates.
Many cannot foresee the problems however because they start slowly and accelerate over time and people think very short term. The logic cannot be denied however, and you can see from the following image which I’ve drawn out by hand below:
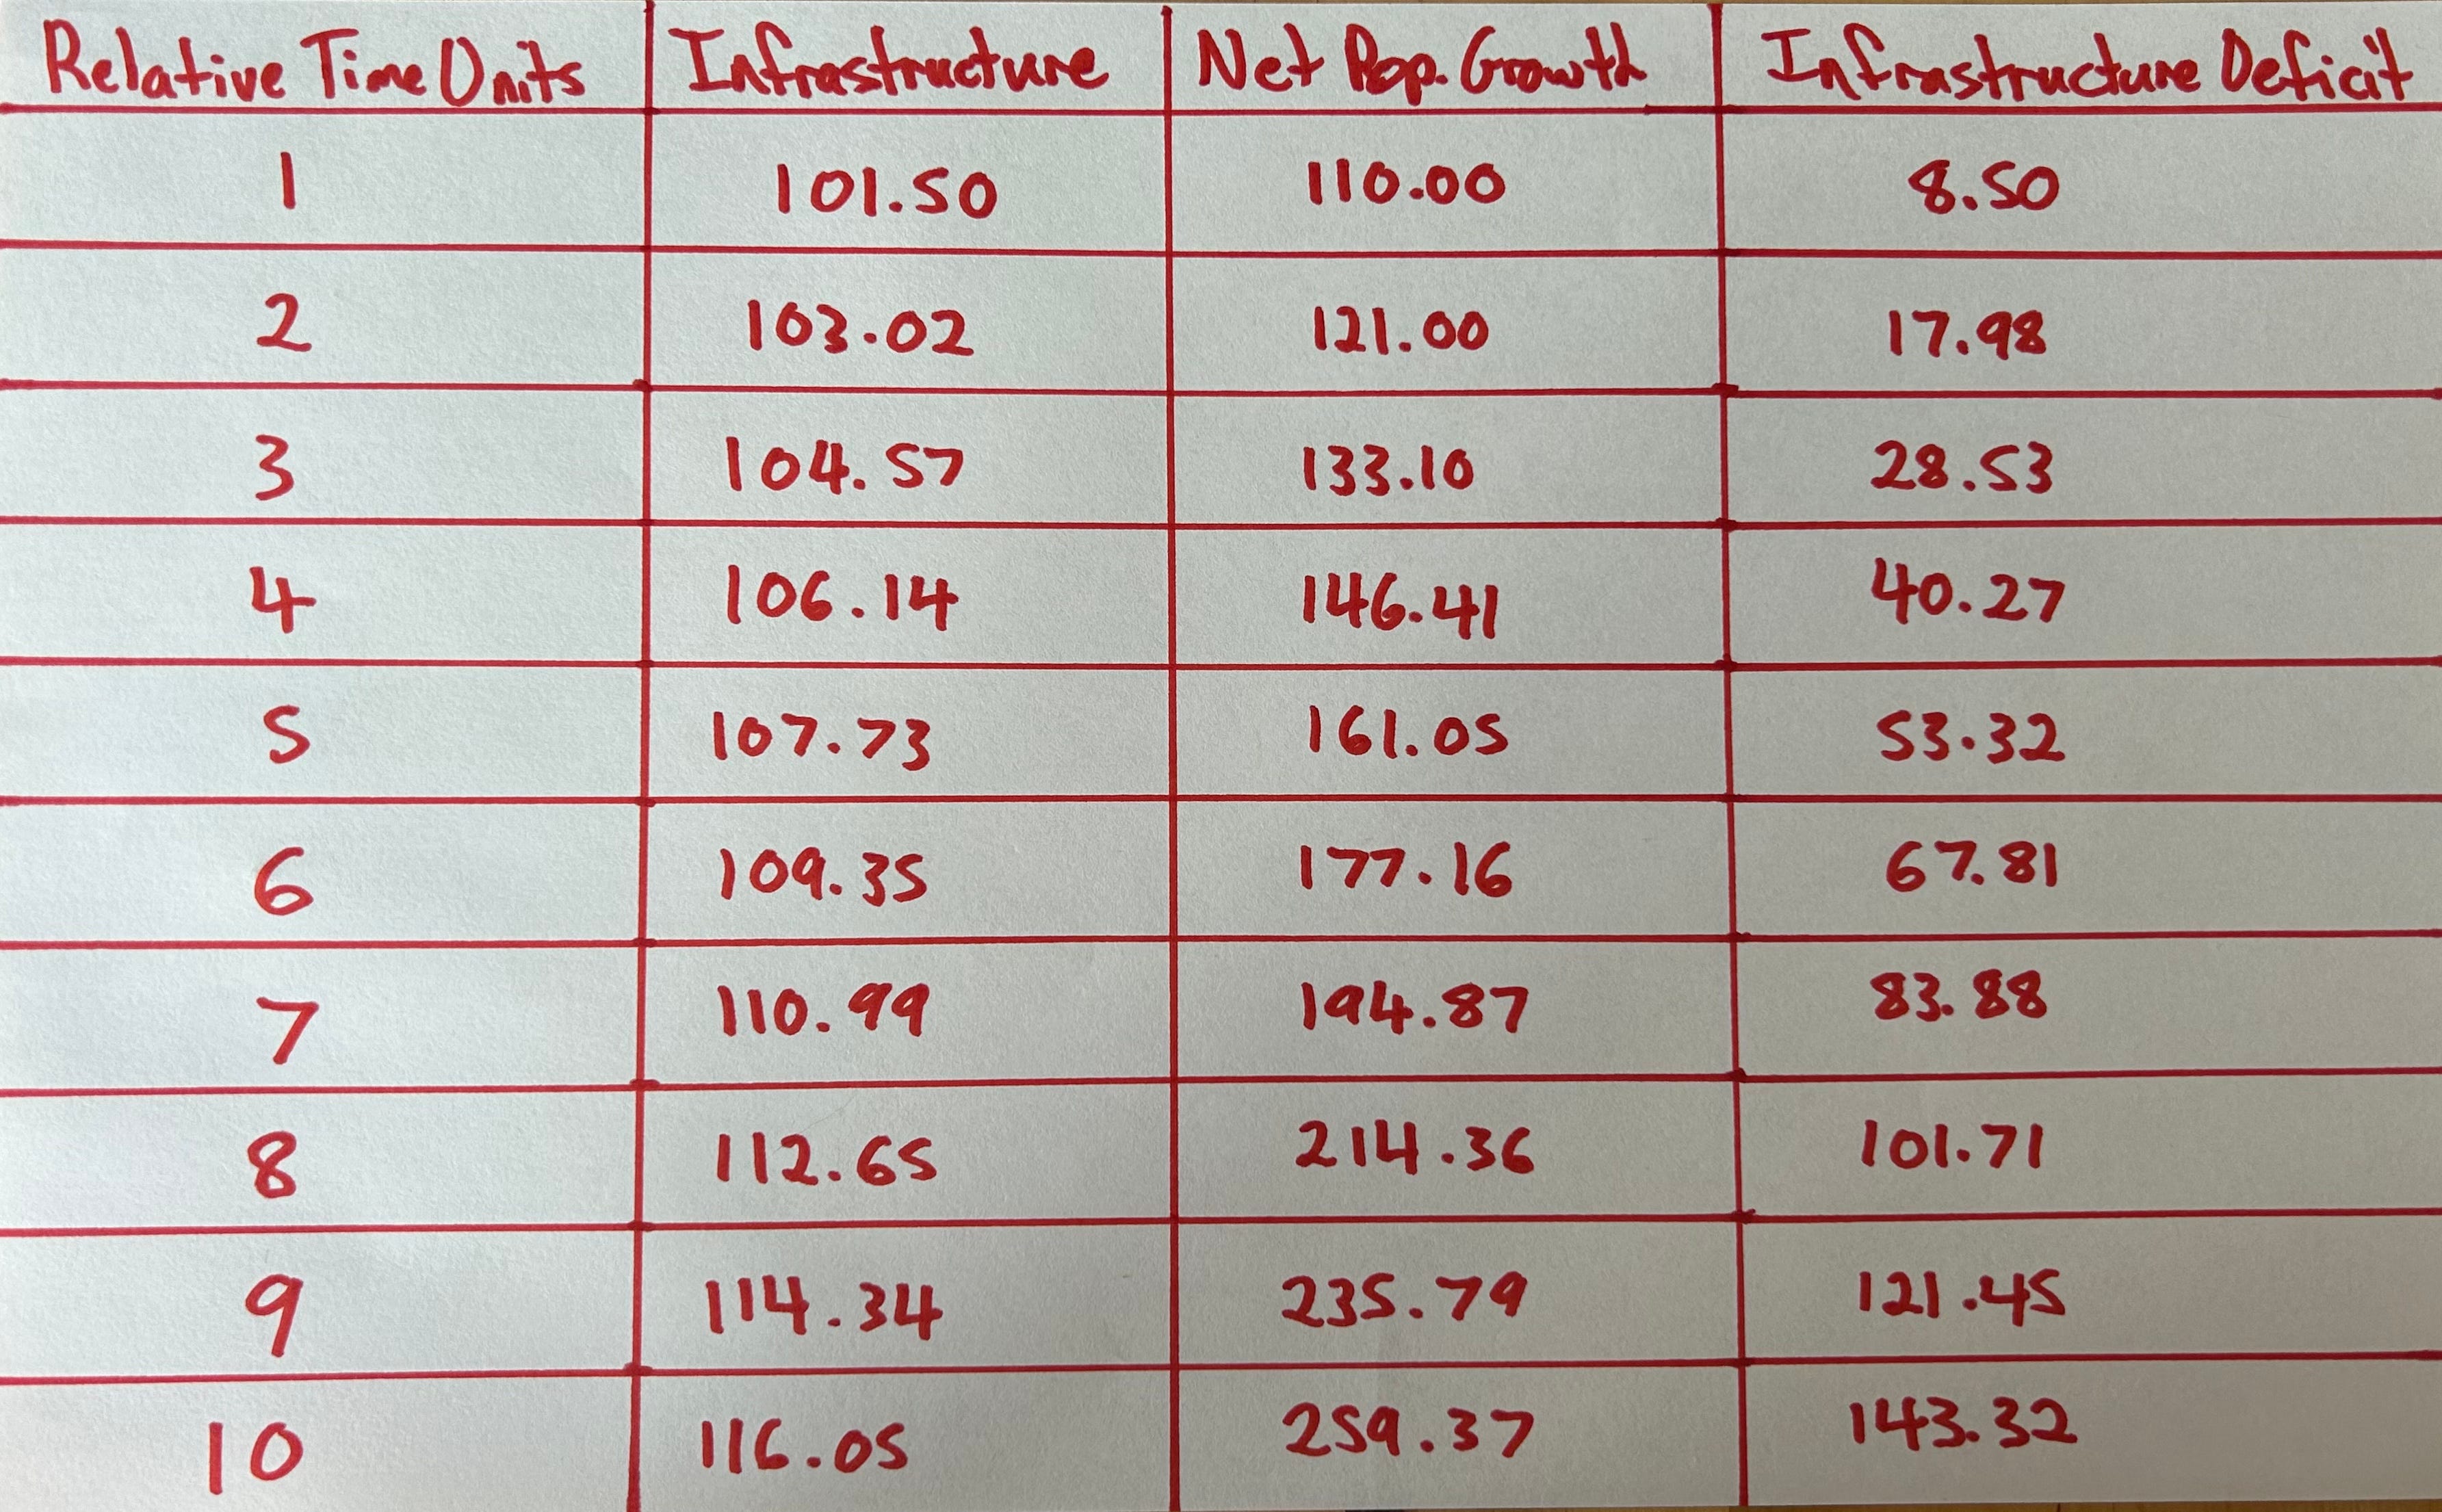
Relative time units (TUs) are used here in the first column because we don’t really know in which sort of units we are working. The rate of infrastructure development in the second column is a compounding rate of 1.5% per time unit. This of course could be altered to any degree and you will get different numbers as result. I chose this number as it is likely quite generous. I came up with it as a high end, given that underground pipe infrastructures are repaired at 0.5% per annum but degrade at 1.5-2.0% per annum. Since a very basic necessity of a higher human development index (HDI) is access to water and sanitation, I figure this may be a decent starting point, which would mean the numbers could be far worse than I’m implying in this chart, being that I’ve DOUBLED the existing maintenance and growth of infrastructure in order to leave a large margin for error. But regardless, you can see how this effect of 1.5% compounds from a starting point of 100, and after 10 TUs is 116.05, or an increase of infrastructure of 16.05%, or an average of 1.605% per TU (through compounding, which is a fair, if not generous assumption in the chart).
In the third column, I again started at 100 as the starting population, so we can see the relative rate of growth in comparison just like in the infrastructure column. Here I wasn’t sure what to put for rate of net population growth, so I went with a flat number of 10%. Over how many years, who knows, but for a country like Canada, this would equate to a 3 year or so cycle at current rates of immigration. The current plan for Canada is that by 2100 AD, Canada will have over 100 million people. In this chart, if we hit a 10% increase in population every 3 years, within 30 years we will be at some 103.75 million by 2053 (40M x 2.5937 = 103.75M).
This would be far faster than currently scheduled by the existing Ottawa Interregnum, but that’s what our current rates of immigration suggest. If this is true, and the chart numbers uphold the infrastructure development rate (double the CURRENT rate of decline of sanitation and water infrastructure) than those 103.75 million Canadians will have to deal with an infrastructure developed for some 46.42 million people (40M x 1.1605 = 46.42M) in equivalent 2023 infrastructure levels.
Even assuming we catch up (somehow) in our sanitation and water infrastructure, we will have fewer than half of the doctors, engineers, pilots, scientists, mechanics, tradesmen, industrial farm equipments and manufacturing (meaning we will be net food-importers at some point). This is assuming we can even get a drink of clean water or have indoor plumbing.
Assuming these things, we will likely have much smaller living spaces as well, literally “Canadian Favelas”, and a decline in centralized government rule.
In the fourth column, I show the relative acceleration of infrastructure deficit as well, in the first term being 8.5%, and by the 10th term 143.32%. This matches roughly what we may be facing in terms of the Canadian immigration rate and plan, which is likely the most “ambitious” of any western nation. In relative terms, if the UK had the same rate of immigration that Canada has had this past year, it would have taken over 2 million LEGAL immigrants (on top of whoever else finds their way in). The last I checked, the UK took in a net of 500,000 immigrants last year, meaning the rate of immigration to Canada is over 4 times that of the UK. Though we can acknowledge that the UK is far smaller than Canada, it is important to note that most of Canada is tundra and arctic, or boreal forest. More than 90% of the Canadian population lives within 100 km of the US border, and most of the remainder survive in Edmonton. The vast majority of all immigrants end up in Greater Vancouver, Southern Ontario (largely Greater Toronto), and the Montreal area.
Given the deficit rate of 143.32%, and comparing that to the infrastructure level of 116.05%, we can see that the deficit is HIGHER than the supply itself. It is difficult to quantify this so I must use an analogy of some sort to lay it out.
I will use water as an example. Imagine in time cycle zero that you need 2 litres of water per day in order to survive (commonly known to be the case). By end of cycle 1, you would need 2 L but only have 1.83 L available on average. How will people get their needs met? No idea. As for end of cycle 2, you will still need 2 L of water but only 1.64 L will be available on average. If you continue the math, by the time you get to cycle 8, there is no water available. You are in negative water supply. By cycle 10, you need 2 L of water per day but you actually have none and also now owe 0.87 L of water per day. Essentially there is no water for you, unless you pay a massive price for it.
Of course this analogy cannot take you that far because society will have likely collapsed long prior to this scenario, and it is likely that out of all the infrastructure that could be developed water would be the first option, but that doesn’t mean you are much better off. Maybe you will have water, but you won’t have much else, and in other areas of life you could be far far worse off than imagined in these scenarios.
In order to keep up current living standards where young people cannot afford homes and remain in their parents spare bedrooms, basements, or forever renting, Canada would require a rate of infrastructure development that far exceeds current rates. Recently in British Columbia, where many immigrants settle, contributing to a massive increase in the prices of homes, the Provincial Government run by NDP Premier David Eby, promised to help develop 100,000 homes over the next 5 years. If BC took in the exact proportion of immigrants per year as if all immigrants settled evenly throughout Canada, BC’s proportion per year would be 127,500 people. Eby’s housing problem solution could not even address one fifth of this, and we are already in a massive housing shortage.
Even prior rates of immigration which saw between 40,000-80,000 immigrants per annum could not be saved through the Eby plan, most of which relies on private sector developers, at market rates which are mostly unaffordable to average residents. BC has an arterial wound in housing and the province is putting a bandaid on a cat-scratch.
We know the housing issue is not being solved. It can’t be, given the rates of population growth through immigration. This issue is not exclusive to BC, nor Canada, but the entire Western World. When I say it is a disaster, that doesn’t do the problem justice. It is apocalyptic in scale. This isn’t about ethnography. This isn’t about culture. This isn’t about anything but the laws of physics and economics in action.
In fact, this just seems to further justify my earlier article “Exodus”. I’m afraid Exodus is no longer a question of “if”, but “when”, should nothing else change the course of the West’s resolute dedication to civilizational Seppuku.
Leviathan sleeps.
-N.D. Wallace-Swan
125